Economic Freedom Continuum
Economic Freedom Continuum
(1 Editable Slide)
Economists, strategists, and government authorities can leverage our compelling Economic Freedom Continuum PPT to comprehensively illustrate the measures and parameters used to determine a country’s economic freedom index rankings. You can also exhibit the benefits of measuring economic freedom, explaining how investors can use it to monitor the shift in the economies and make decisions regarding discontinuing or further investing.
About the Design
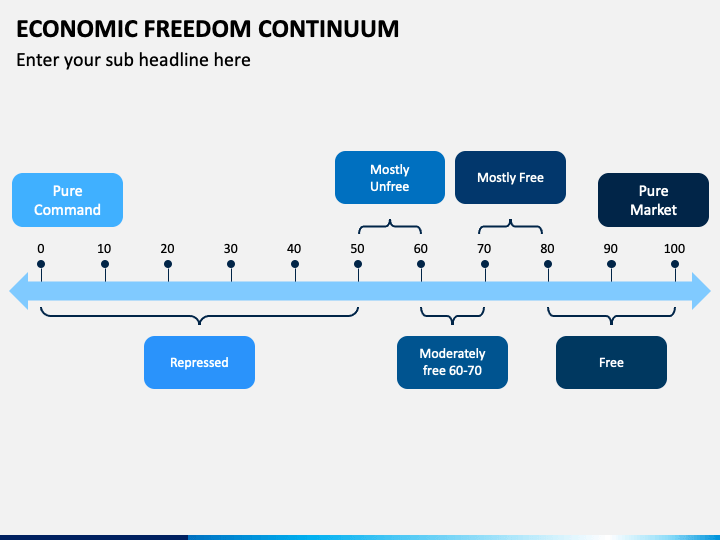
The slide portrays a scale infographic with 0 to 100 ratings.
- 0 – 10 – Pure Command
- 0 – 50 – Repressed
- 50 – 60 – Mostly Unfree
- 60 – 70 – Moderately Free
- 70 – 80 – Mostly Free
- 90 – 100 – Pure Market
- 80 – 100 – Free Economy
The low ranking describes the weak control of citizens of a specific country over their labor and property. On the other hand, the high ranking represents the country is economically free, and the citizens are free to manufacture, consume, or invest anywhere they want.
Key Features
- You can conveniently modify the graphic according to your preferences, replace the existing textual information, and amend other elements without facing any challenges.
- By downloading the PPT once, you can use it for a lifetime.
- Each element is designed after meticulous research; hence, presenters will not confront copyright infringement issues.
Download it right away and present eye-pleasing slideshows!


