


Current Vs Previous PowerPoint and Google Slides Template
Current Vs Previous PowerPoint and Google Slides Template
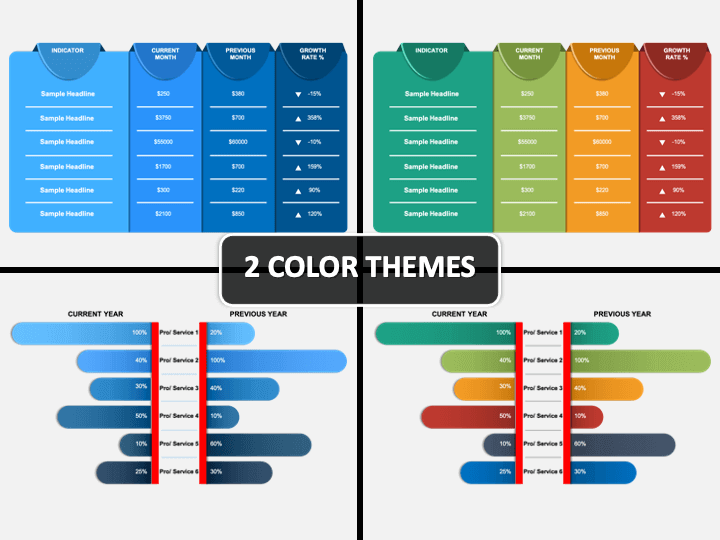
(6 Editable Slides)

(6 Editable Slides)
Related Products


Tracking performance at regular intervals is essential to ascertain whether the organization is on the right path and making profits, or a gap exists between the expectations and reality. We have come up with an all-new Current Vs Previous PPT template through which you can beautifully showcase the comparison of your organizational current and previous performance. Leveraging the high-quality and vector-based illustrations, you can exhibit the monthly, quarterly, and yearly comparison between multiple aspects comprehensively while mentioning the reasons for the positive/negative difference.
Product managers, team leads, department heads, senior business executives, and business consultants can use this set to portray their team’s performance, change in a particular product’s demand, and much more. Furthermore, stealing the audience’s attention becomes very easy using this deck, as it has a unique combination of striking colors and high-definition infographics.
Key Attributes of the Set
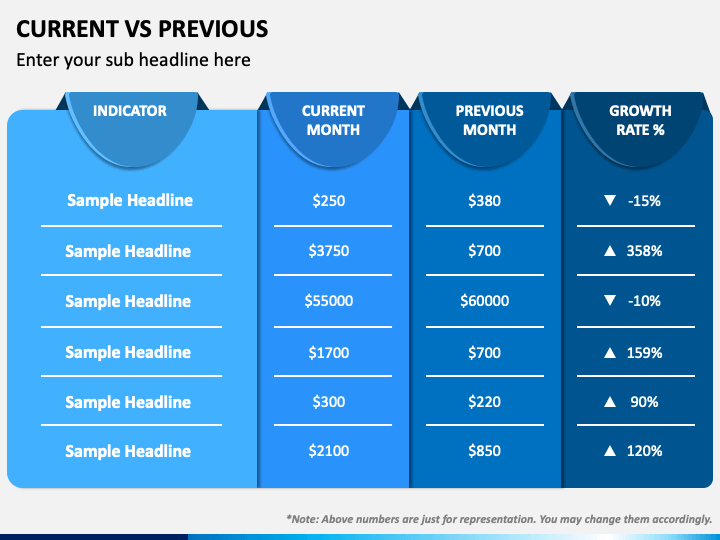
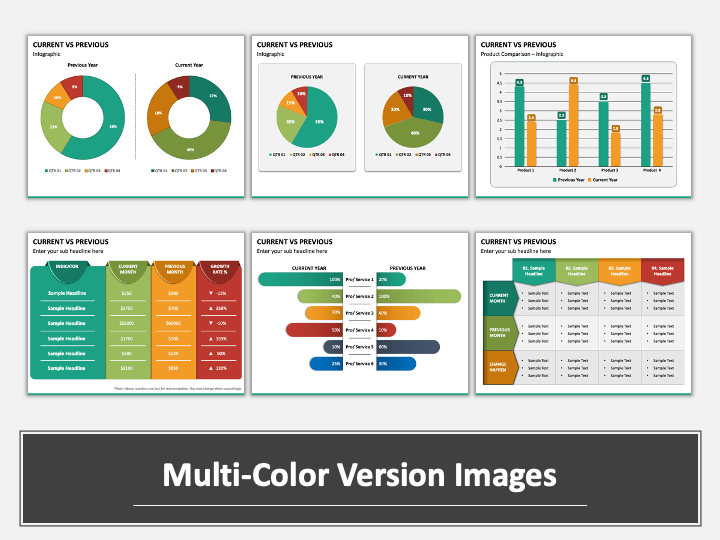
- Using the table depicted in one of the slides, you can illustrate the comparison of monthly sales, revenues, and profitability, and mention the difference as growth or reduction.
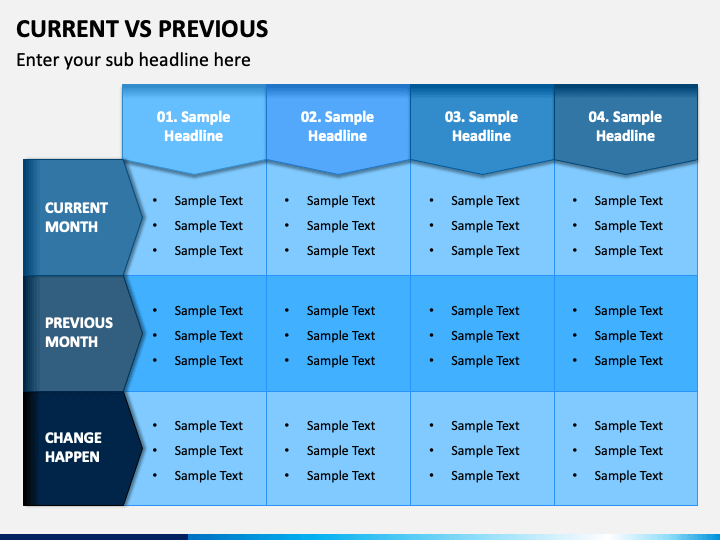
- The other one also contains a table that can be used to demonstrate the monthly comparison between multiple components and depict the reasons for the change/difference.
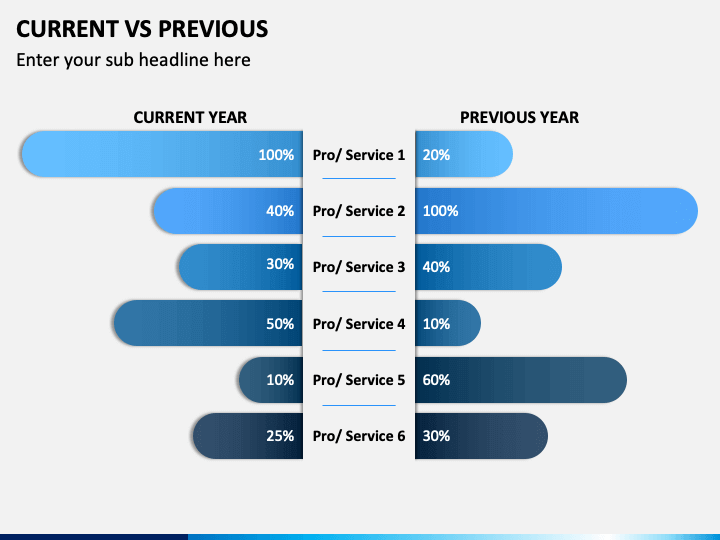
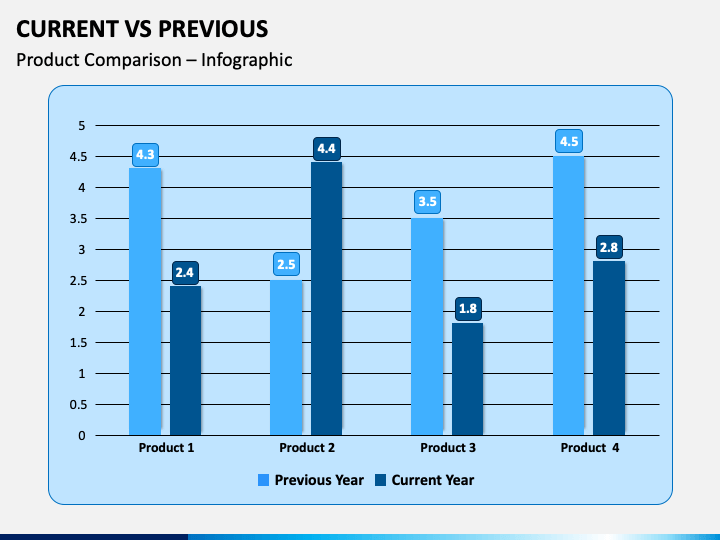
- The bar graphs showcased in some of the slides can be used to represent the yearly product/service performance comparison.
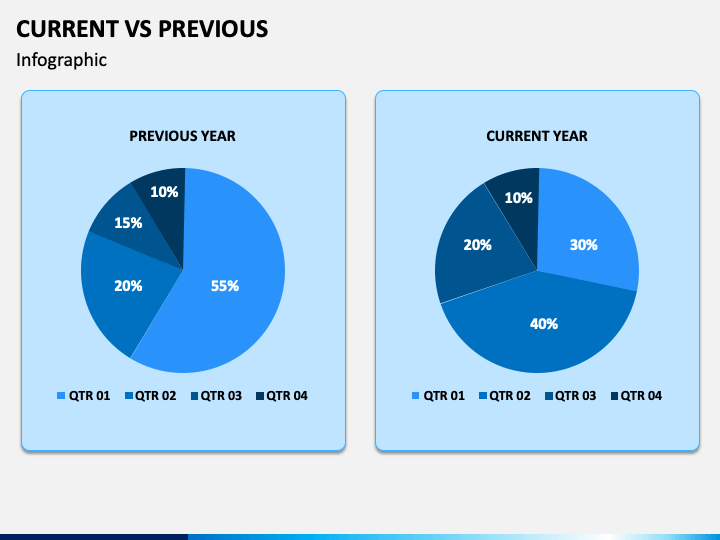
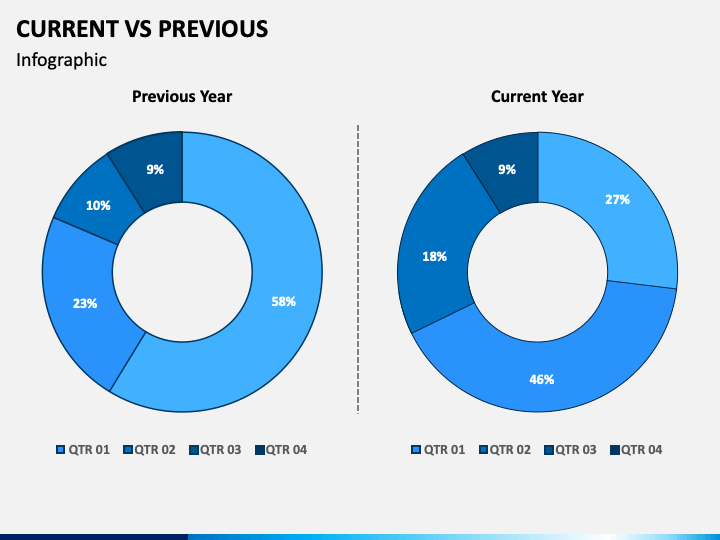
- Some slides contain two pie charts diagrams. One can be used to portray the quarter-wise performance of the current year, while the other one can be used to depict the previous year’s performance.
Features
- You can easily recolor and resize the visuals according to your requirements without any technical skills and external aid.
- There are no restrictions on including either one of the infographics or the complete deck in your existing and future presentations.
- Every illustration has been designed in high-resolution and from scratch to help you present on any screen size, without fretting about the quality issue.
- Perfectly compatible with MS PowerPoint, Apple Keynote, and Google Slides.
So, download it without any delay and win over the audience!