


Radial Charts for PowerPoint
Radial Charts for PowerPoint
(10 Editable Slides)


(10 Editable Slides)


When you have a whole lot of information to convey and words aren't enough for expressing your point, visuals change the entire scene! For this creative advantage including our professionally created PowerPoint Radial Charts Template work the best. From explaining processes and operations to defining relations of various elements to the concept that underlies them, the diagram gives you best assistance. Use the set for variety of purposes and add power to your message. The bold graphics and appealing designing make it an instant attention grabber. You have a more effective way to express your view.
Regardless of industry and your presentation theme, the template will aptly fulfill your needs. So, it is a typical business meeting and you have to demonstrate the components of business continuity? Or you are a young lawyer at a law firm and have to explain your firm's practice areas? Or perhaps you are a fitness trainer and have to explain the relation between health, fitness and exercises? Whatever you have to illustrate, the slides will fit in well with your purpose. This is because they offer an earnest level of flexibility and total versatility. Compare, contrast, relate, do whatever you want, the uniquely designed radials on the set will always prove dependable.
There is absolutely no messy work of slide creation right from the beginning. Nor you need to hire some special designer to sort out your stuffs. You save whole lot of time, efforts, and resources. And yet you are awesome at the visualization.
About
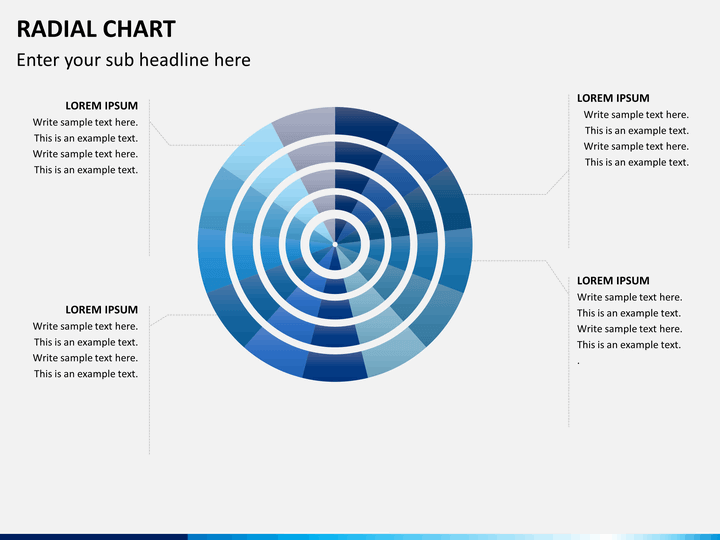
Radial Charts are a kind of graphical diagrams with values extending to or from a central point showing relationship of each of the variables with the central point. This is why these diagrams are generally used for establishing relationships of multivariate elements to a core or central element. A diagram may show the progress of the flow either from outside in or inside out.These are yet another type of simple to follow organization charts with only difference that these start from the center whereas the conventional ones start from the top.The diagram is named Radial because in it the items are found to be radiating from the center.